Analysis
The Fall of Empires
Record US debt, property and demography in China, a war economy in Russia, stalled growth in Europe: the causes, mechanisms, risks and solutions, explained step by step with 13 charts and diagrams.
In the 16th century, Philip II's Spain was the world's leading power. It had the silver of the Americas, the best infantry in Europe and an empire "on which the sun never sets". Yet it defaulted on its debts several times during that one reign. Empires rarely fall because an enemy topples them. They fall mostly because they can no longer pay for what they promised.
In 2026, four great blocs, the United States, China, Russia and Europe, each show a warning light. They are not the same lights, and none of them signals a collapse tomorrow. But for the first time in a long while, all four are on at once.
This article is long, because the subject demands it. It is built to be understood without any training in economics: we start with the basics, go back to the causes, examine each empire, then look at how a crisis could spread and, above all, at what leaders can still do. Each part can be read on its own.
We separate facts (with figures and sources), estimates from institutions such as the IMF, and our own reading, flagged as such. This is not investment advice.
The essentials
- United States: federal debt passed $40 trillion on Aug. 18, 2026, and interest on the debt ($1.1 trillion in fiscal 2026) now costs more than the military. Causes: unfunded tax cuts, the 2008 and 2020 crises, ageing, rising rates.
- China: growth holds around 4.5%, but property is collapsing, prices are flat, the population is shrinking, and "augmented" public debt exceeds 135% of GDP according to the IMF. Root cause: a model driven by investment and property rather than household consumption.
- Russia: the war economy is running out of breath (growth near 1%), the reserve fund has more than halved, credit still costs 14% and VAT has risen to 22%. Cause: a war that absorbs nearly 40% of the federal budget.
- Europe: the euro area grows by about 1% a year; France has reached 119% debt and will soon pay more in interest than it spends on schools. Causes: weak productivity, ageing, the energy shock, new defense spending.
- The common thread: high debts just as money has become expensive again. The IMF expects global public debt to exceed 100% of GDP by 2029.
- Solutions exist: Britain after 1945 and Canada after 1995 sharply reduced their debt. They combined growth, fiscal discipline and credibility, and took time and political courage. More recently, Sweden, Germany and Portugal did it without post-war growth.
Contents
- The basics: understanding debt in ten minutes
- How did we get here?
- United States: the empire that pays more for its debt than for its army
- China: growing old before growing rich
- Russia: the war economy that feeds on itself
- Europe: rich, but stalled
- The risk dashboard
- How a crisis could spread
- Solutions: what works and what doesn't
- Our reading, FAQ and sources
1. The basics: understanding debt in ten minutes
The words to know
Before going further, here are the eight words that come up throughout the article. No need to learn them by heart: come back to this table whenever a term escapes you.
| Word | What it means | Simple example |
|---|---|---|
| GDP | All the wealth a country produces in a year | The country's "revenue" |
| Deficit | What the state spends beyond what it takes in over one year | A month in which you spend $2,200 on a $2,000 salary |
| Debt | The sum of all past deficits that have not been repaid | The total of your outstanding loans |
| Debt as % of GDP | Debt compared with the wealth produced in a year | 100% = a whole year of the country's output |
| Bond | An IOU the state sells to lenders, which pays interest | A "Treasury bond" |
| Interest rate | The price of borrowed money, in % per year | The rate on your mortgage |
| Primary surplus | The budget is positive before paying interest on the debt | You put money aside before repaying your loans |
| Sovereign rating | The trust grade given to a state by agencies (S&P, Moody's, Fitch) | AAA = the best, then AA, A, BBB… |
How a state borrows
A state does not go to the bank like an individual. It sells bonds: securities that say, in essence, "I will give you back 100 in ten years and pay you 3 a year in the meantime". These securities are bought by banks, insurers (who invest your life insurance in them), funds, foreign investors and, at times, the central bank.
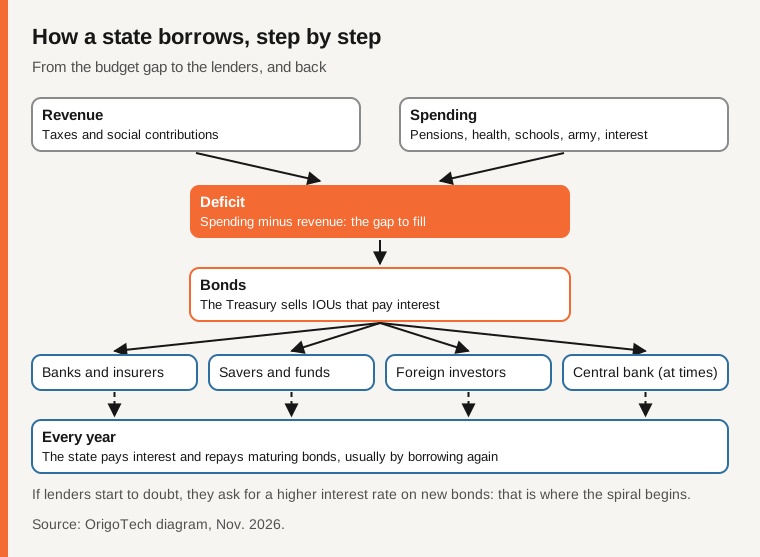
The crucial point is the last box of the diagram: when a bond matures, the state almost always repays it… by selling a new one. A state therefore never really repays its debt; it "rolls it over". That is why a state's debt is not comparable to a household's: a household must repay before it disappears, a state does not disappear.
But this system has a weakness: it rests entirely on confidence. If lenders start to doubt, they demand a higher rate on each new bond. And since the state constantly replaces its old bonds, the increase ends up affecting all of its debt.
The rule that decides everything: interest rate versus growth
Picture a shopkeeper who borrows at 5% to expand. If sales grow 7% a year, the shopkeeper gets richer: the debt weighs less and less relative to revenue. If sales grow only 2%, the debt weighs a little more every year.
A country works exactly the same way. Two numbers are compared:
- the average interest rate the state pays on its debt, written r;
- the growth of its economy (inflation included), written g.
If g is larger than r, the debt "melts" on its own relative to the country's wealth. If r exceeds g, it grows on its own, unless the state runs a surplus before paying interest. The chart below shows this with a fictional country that starts with debt equal to 100% of its GDP.
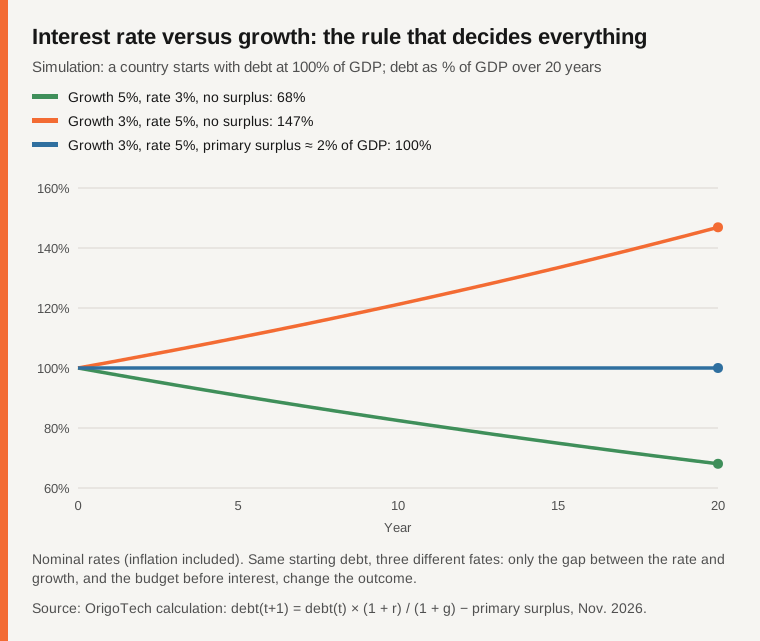
In all three cases, the country starts from the same point. What changes its fate is neither the size of its starting debt nor the goodwill of its leaders: it is the gap between rate and growth, and the fiscal effort. Keep this small table in mind; it sums up the whole mechanism:
| Situation | What happens to debt (as % of GDP) | Effort needed to stabilize it |
|---|---|---|
| Growth > rate | It falls on its own | None; a small deficit is even possible |
| Growth = rate | It stays stable if the budget balances before interest | Primary balance |
| Growth < rate | It rises on its own | A primary surplus, all the larger as the debt is heavy |
This is the heart of the 2026 problem: during the 2010s, rates were below growth almost everywhere. Since 2022, they have risen.
Why have rates risen?
For ten years after the 2008 crisis, central banks kept rates very low, sometimes negative, to support the economy. Money was almost free and states took advantage. In 2021-2022, inflation returned: the post-Covid rebound, shortages, then an energy price surge after the invasion of Ukraine. To curb it, central banks raised rates, quickly and sharply.
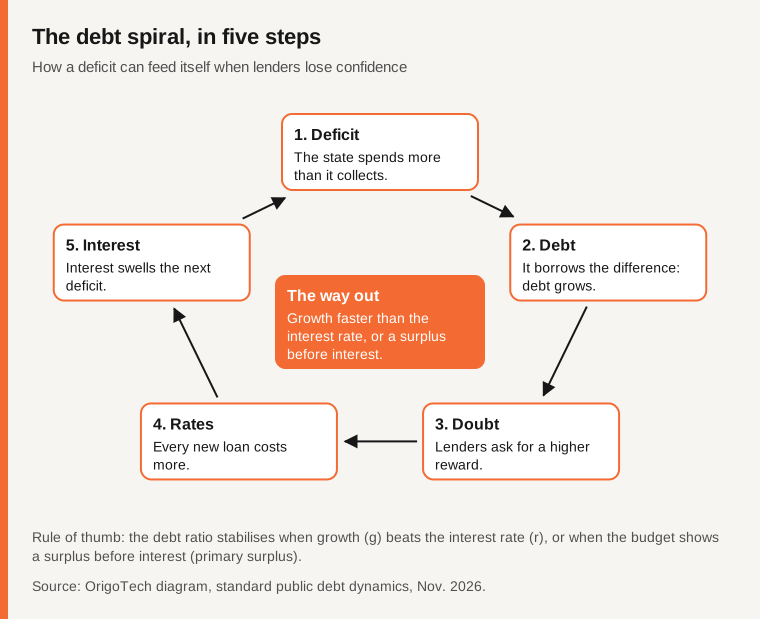
Debt is not refinanced all at once: every month, the state replaces old, cheap loans with new, more expensive ones. So the bill rises slowly, then faster and faster. That is the spiral below.
Three ways to "fall"
When people talk about an economy's "fall", they often mix up three very different scenarios:
| Type of crisis | How it plays out | Historical examples |
|---|---|---|
| Debt crisis | Lenders refuse to lend or demand unbearable rates; the state must cut brutally or restructure | Greece 2010-2012 |
| Currency crisis | The currency collapses, inflation explodes, savings are wiped out | Argentina, several times |
| Long stagnation | No crash, but years of sluggish growth, weak prices and a debt that keeps getting heavier | Japan after 1990 |
A fourth, shorter form is worth knowing: the confidence shock. In September 2022 in Britain, a budget of unfunded tax cuts sent the pound and gilts tumbling within days, and the prime minister had to leave office a few weeks later. It shows that even a large, rich country is not safe from a warning shot from the markets.
Keeping this distinction in mind is essential: each of our four empires is exposed to a different type of fall.
2. How did we get here?
Today's debts did not fall from the sky. They are the result of a series of shocks, each financed by borrowing, without the calm years being used to repay.
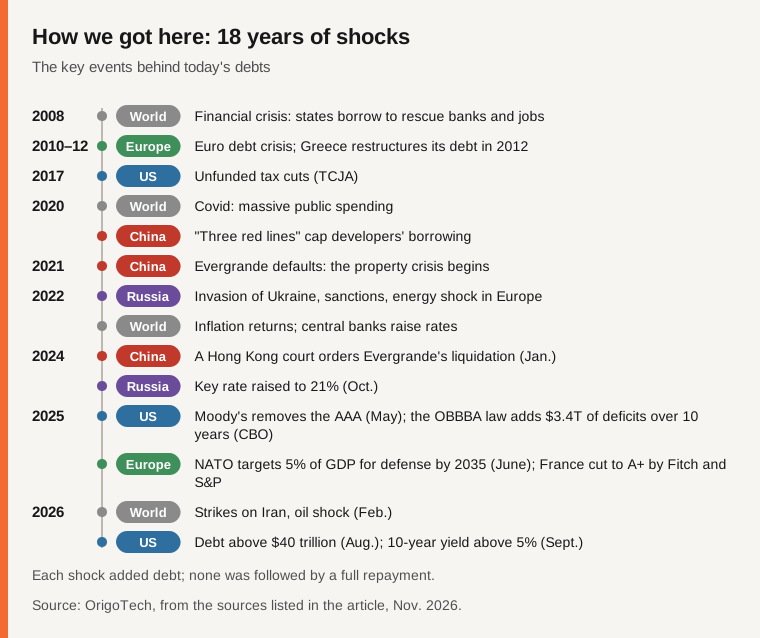
The common causes fall into five broad families:
- Crises were paid for on credit. In 2008 and again in 2020, states borrowed massively to prevent the collapse of banks and jobs. It was probably the right choice at the time, but the debt stayed.
- Free money lulled vigilance. With rates close to zero, borrowing cost almost nothing. Many governments got used to financing everyday spending through debt.
- Ageing costs more and more. More retirees and fewer workers: pension and health spending rises mechanically, while revenue grows more slowly.
- Growth has slowed. Productivity gains, the ability to produce more with the same amount of work, are weaker than in the 20th century in most rich countries.
- The world has become dangerous again. War in Ukraine, war in Iran, tensions with China: military spending is rising everywhere. NATO members committed in June 2025 to devote 5% of their GDP to defense and security by 2035, including 3.5% for core defense (OSW).
The result: worldwide, the IMF estimates that public debt reached 94% of GDP in 2025 and could exceed 100% by 2029, according to the Fiscal Monitor presented in October 2026 at the annual meetings in Bangkok (Pattaya Mail). That would be the highest level since 1948, as the Fund had already written a year earlier (IMF).
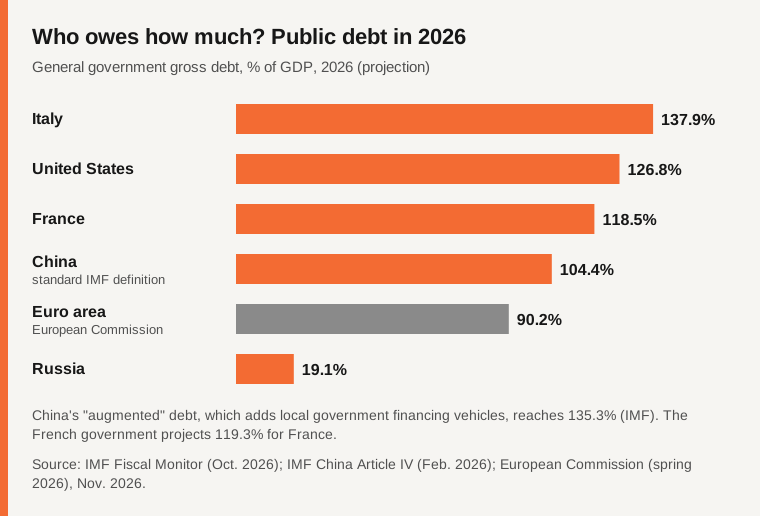
A debt figure alone does not tell the whole story: Italy owes more than the United States, and Russia owes very little. What matters is the combination of debt, rates, growth and confidence. Let us look at each empire through that lens.
3. United States: the empire that pays more for its debt than for its army
Key figures
| Indicator | Value | Source |
|---|---|---|
| Gross federal debt | $40,047 billion (Aug. 18, 2026) | Treasury, via Bernama |
| Public debt, % of GDP | 126.8% (2026) | IMF |
| Fiscal 2026 deficit | $2.0 trillion (7.4 of spending, 5.4 of revenue) | AAF, from the Treasury |
| Interest on the debt, fiscal 2026 | $1.1 trillion, more than defense | AAF |
| 10-year Treasury yield | above 5% on Sept. 15, 2026 | Trading Economics |
| Growth forecast for 2026 | 2.3% | IMF |
| Credit rating | No AAA left since May 2025 | Moody's |
The facts
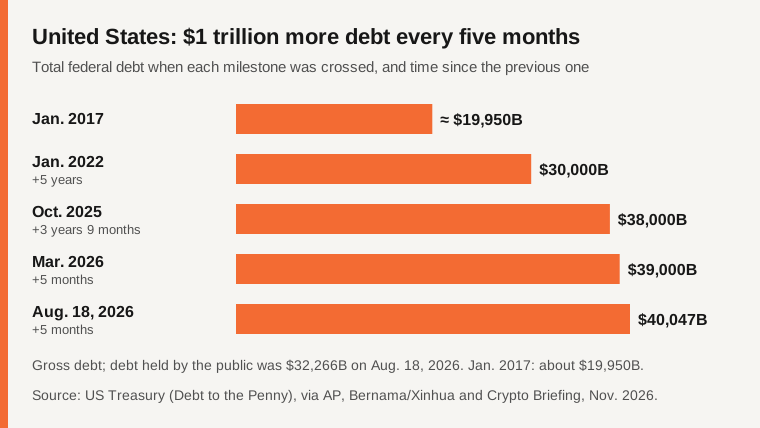
Gross federal debt crossed $40 trillion on Aug. 18, 2026, at $40,047 billion, of which $32,266 billion was held by the public, according to Treasury data relayed by Bernama and Xinhua (Bernama). It was about $19,950 billion in January 2017: it has doubled in under ten years (Crypto Briefing via KuCoin). It passed $38 trillion in October 2025, then $39 trillion in March 2026 (WFTV, citing AP). Roughly a trillion dollars more every five months.
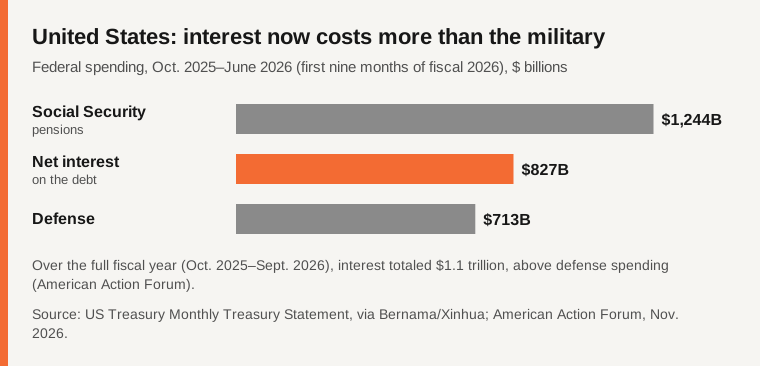
Fiscal year 2026 (October 2025 to September 2026) closed with a $2.0 trillion deficit. Interest on the debt reached $1.1 trillion and exceeded defense spending, according to the American Action Forum, a center-right think tank analyzing the Treasury's final statement (AAF). Over the first nine months of the fiscal year, net interest ($827 billion) was already above defense ($713 billion) and second only to Social Security ($1,244 billion) (Bernama).
The causes
1. Unfunded tax cuts. The federal budget has been in deficit every year since 2001 (Reason). Several major tax reforms cut revenue without matching spending cuts. The latest, the "One Big Beautiful Bill Act" signed in July 2025, extends and makes permanent the 2017 tax cuts; according to the Congressional Budget Office (CBO), Congress's nonpartisan budget office, it adds nearly $3.4 trillion to deficits over ten years, excluding interest (Washington Examiner). The White House argues that, combined with the rest of its economic policy, tariffs in particular, it will reduce deficits.
2. Two crises paid for on credit. The 2008 rescue and the 2020-2021 Covid packages added several trillion dollars of debt in a very short time.
3. Ageing. Pensions (Social Security) and health insurance for seniors (Medicare) are the fastest-growing expenses. According to its trustees' 2026 report, the fund that pays retirement benefits will be depleted in late 2032; after that, revenue would cover only about 78% of scheduled benefits, absent reform (CRS, NARSSA).
4. Rising rates. On Sept. 15, 2026, the yield on the 10-year Treasury rose above 5%, its highest since July 2007, as oil surged on the Iran war and fiscal worries grew (Trading Economics). The Federal Reserve raised its rate in September to 3.75–4.00%, then held it on Oct. 28 (investingLive).
5. Political deadlock. Neither major party has a stable majority for a long-term plan, and the debt ceiling regularly triggers standoffs. In May 2025, Moody's removed the United States' last AAA rating, citing debt and interest ratios significantly higher than those of similarly rated countries (Washington Examiner). S&P had done so in 2011 and Fitch in 2023.
A symbol: "Ferguson's Law"
In 2025, historian Niall Ferguson proposed a rule he calls "Ferguson's Law": a great power that spends more on servicing its debt than on defense risks ceasing to be a great power (Hoover Institution). In his view, the United States crossed that line as early as 2024. His examples run from Habsburg Spain to the Ottoman Empire and post-1918 Britain. The rule is disputed: critics note that in several of these cases decline began before the line was crossed, and that 18th-century Britain crossed it without declining (The Pynx). It is a warning sign, not a prophecy.
What still holds
The United States remains the most dynamic economy of the group: the IMF expects 2.3% growth in 2026 and 2027, driven in part by investment in AI (Trading Economics). Above all, it borrows in its own currency, the dollar, which remains the world's main reserve currency. Moody's itself acknowledged that, despite the downgrade, the country retains exceptional strengths: the size and dynamism of its economy and the dollar's role (PBS, citing AP). The Treasury market is the deepest on the planet: buyers are not scarce, they simply ask for more.
Three scenarios for the decade
These scenarios are illustrations built by OrigoTech to help think things through, not numerical forecasts.
| Scenario | What happens | Consequence |
|---|---|---|
| Soft landing | AI-driven productivity speeds up growth; a budget compromise stabilizes the deficit | Debt stabilizes, rates fall |
| Slow erosion (closest to the current trend) | Deficits around 6% of GDP, interest rising steadily | Interest crowds out other spending; room for maneuver melts |
| Rate shock | Investors demand a large premium; the dollar is challenged | Sharp rise in global rates, forced cuts |
4. China: growing old before growing rich
Key figures
| Indicator | Value | Source |
|---|---|---|
| Growth, Q3 2026 | 4.5% year on year | National Bureau of Statistics |
| Property investment (Jan.-Aug. 2026) | −19.2% year on year | BBVA Research |
| Inflation forecast for 2026 | 0.8% | BBVA Research |
| Population, end of 2025 | 1.405 billion (−3.39 million) | Caixin |
| Official budget debt | 75.1% of GDP (2026) | IMF |
| "Augmented" debt | 135.3% of GDP (2026) | IMF |
| Household consumption | about 40% of GDP | IMF |
The facts
Chinese growth still looks respectable on paper: 4.5% year on year in the third quarter of 2026 and 4.6% over nine months, within Beijing's target range of 4.5% to 5% (Yeni Şafak, citing the National Bureau of Statistics). Some analysts doubt these figures: Rhodium Group, for example, estimates that real growth in 2025 was below 3% (Rhodium Group). But even taking the official numbers, three cracks are visible.
- Property. By the end of August 2026, property investment was still down 19.2% year on year, dragging total investment down 7.2% (BBVA Research).
- Prices. BBVA Research expects only 0.8% inflation in 2026. When prices stagnate, debts weigh more, because loans are repaid with money that is worth "more" than when it was borrowed.
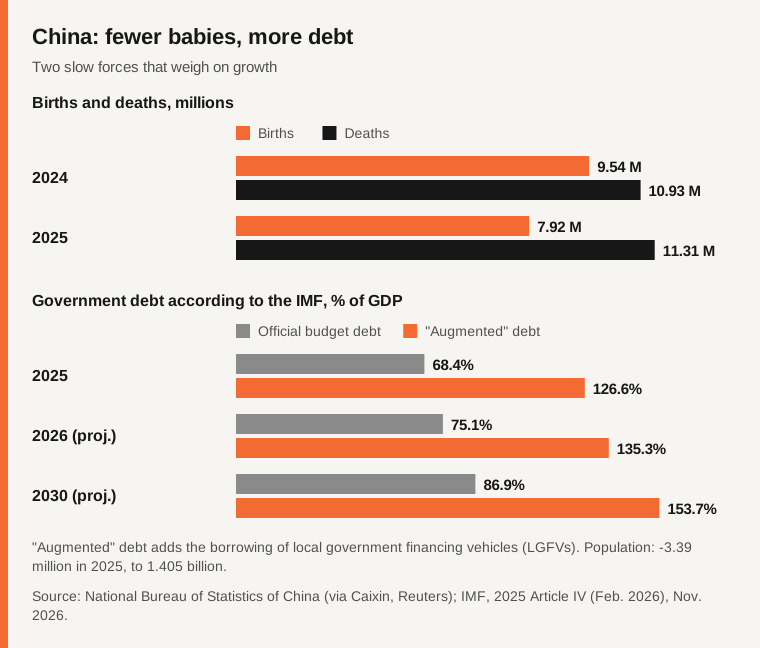
- Demography. The population fell for the fourth year running in 2025, by 3.39 million, to 1.405 billion. There were 7.92 million births, 17% fewer than in 2024, against 11.31 million deaths (Caixin).
The causes
1. A growth model built on concrete. After the 2008 crisis, Beijing revived the economy through investment: roads, housing, factories. Property long drove about a quarter of China's economic activity (Business Standard). Some 70% of Chinese household wealth is in real estate (Business Day): when prices fall, families feel poorer and spend less.
2. The bubble bursts. In August 2020, the government imposed the "three red lines" on developers, borrowing caps meant to deflate the bubble. Evergrande, then one of the world's largest developers, defaulted in 2021 on more than $300 billion of debt, followed by Sunac in 2022 and Country Garden in 2023 (Gulf Times). On Jan. 29, 2024, a Hong Kong court ordered Evergrande's liquidation (CFR).
3. Local governments that lived off land sales. Provinces and cities funded much of their budgets by selling land to developers, and borrowed off budget through financing companies (LGFVs). When property collapsed, that revenue disappeared, but the debts remained. That is why China's public debt varies by a factor of almost two depending on the definition: the IMF counts 75% of GDP in 2026 for official budget debt, but 135% for "augmented" debt, which includes LGFVs, and sees it climbing to nearly 154% by 2030 (IMF, Article IV). At the end of 2024, Beijing launched a 10-trillion-yuan program to swap part of this hidden debt for cheaper official bonds (Caixin).
4. Households that consume too little. Household consumption accounts for only about 40% of China's GDP, against 68% in the United States and 52% in the European Union (Caixin). Families save a lot out of caution, because pensions, health care and unemployment are less well covered than in rich countries. The economy therefore depends on investment and exports, which makes it vulnerable to trade tensions.
5. Demography. The one-child policy, applied from 1980 to 2015, durably reduced the number of young people. Fewer young people means, over time, fewer workers, fewer home buyers and more pensions to fund. Hence the often-used phrase: China risks "growing old before growing rich".
What still holds
China's debt is almost entirely owed to Chinese lenders, in yuan, at banks the state controls. A Greek-style crisis, where foreign creditors cut off funding, is therefore unlikely. China also remains a leading industrial and technological power: in 2025, its trade in high-tech products grew 11.4% (IMF, Finance & Development). The risk looks more like Japan after 1990: not a crash, but years of sluggish growth and weak prices.
Three scenarios for the decade
| Scenario | What happens | Consequence |
|---|---|---|
| Successful rebalancing | Stronger safety net, households spending more, local debts cleaned up | Slower but sturdier growth |
| Japanification (closest to the current trend) | Flat prices, property that doesn't recover, rising public debt | A decade of weak growth |
| Financial accident | Chain defaults by local governments or regional banks | Global shock through trade and commodities |
5. Russia: the war economy that feeds on itself
Key figures
| Indicator | Value | Source |
|---|---|---|
| Growth 2024 → 2025 → 2026 (forecast) | 4.3% → 0.6% → 0.9% | The Moscow Times, IMF |
| Key rate | 14% (after a 21% peak) | Bank of Russia |
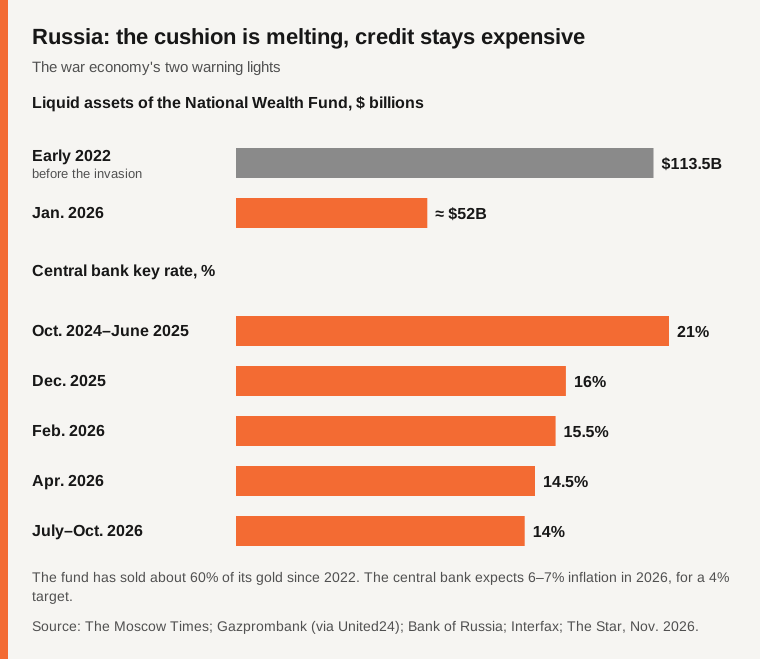
| National Wealth Fund (liquid assets) | $113.5B early 2022 → about $52B Jan. 2026 | United24, citing Gazprombank |
| Defense and security | about 38% of the 2026 federal budget | The Moscow Times |
| VAT | 22% since January 2026 (from 20%) | The Moscow Times |
| Public debt | about 19% of GDP | IMF |
The facts
Driven by military spending, Russian growth reached 4.3% in 2024 before falling to 0.6% in 2025 (The Moscow Times). For 2026, the IMF expects 0.9% (Interfax) and the Bank of Russia between 0% and 1% (Interfax).
Two warning lights are red.
- The safety cushion is melting. The National Wealth Fund, the savings built up from oil, held $113.5 billion in liquid assets before the invasion of Ukraine. Only about $52 billion remained in early 2026, or 1.9% of GDP, and Gazprombank estimated it could be emptied in a little over a year at January oil prices (United24). About 60% of the fund's gold has been sold since 2022 (The Moscow Times).
- Credit remains prohibitively expensive. To curb the inflation created by military spending, the central bank raised its key rate to 21% in October 2024. It brought it down to 14% in July 2026 and left it there in September and October (Interfax). A civilian business that must borrow at these rates stops investing.
The causes
1. An economy entirely geared to war. A war economy is like an athlete on adrenaline: it produces a lot in the short term (tanks, shells, high wages for soldiers and arms workers), but these goods create no future wealth, and the effort exhausts the rest of the body. In 2026, defense and domestic security make up about 38% of the federal budget, only slightly less than the 40% of the previous two years (The Moscow Times). The Carnegie think tank estimates this spending remains around 8% of GDP (Carnegie).
2. Dependence on oil and gas. Hydrocarbons remain the main source of foreign currency. Western sanctions and the price cap reduce this revenue: the share of oil and gas in federal revenue was set to fall to 22% in 2026, according to the Bank of Finland (BOFIT). The US-Israeli strikes on Iran at the end of February 2026 sent oil soaring and brought Moscow extra revenue (The Moscow Times). But the effect faded quickly: in August, a barrel of Russian Urals was worth just over $59, against nearly $95 in the spring (NV, citing Bloomberg).
3. Rising taxes. To fill the gap, Moscow raised VAT from 20% to 22% on Jan. 1, 2026 (The Moscow Times). From January to April 2026, the budget deficit had already exceeded that of the whole of 2025 (Jamestown Foundation).
4. Financial isolation. Cut off from Western markets, Russia can only borrow at home, mostly from state banks, and the cost of that debt is climbing. Debt service is set to take 8.8% of federal spending in 2026, twice the 2021 share (Reuters via Y94).
What still holds
The paradox: Russia has little debt, about 19% of GDP according to the IMF (TASS). It is not threatened by a classic debt crisis. Its danger is not a sudden fall but wear and tear: a civilian economy withering while the war effort absorbs resources.
Three scenarios for the decade
| Scenario | What happens | Consequence |
|---|---|---|
| De-escalation | The cost of the war falls, some sanctions are lifted | Rates can fall, civilian investment picks up |
| Attrition (closest to the current trend) | Long war, average oil prices, rising taxes | Growth near zero, reserves exhausted |
| Oil price collapse | Barrel price durably low | Exploding deficit, inflation, social cuts |
6. Europe: rich, but stalled
Key figures
| Indicator | Value | Source |
|---|---|---|
| Euro area growth, 2026 | 1.1% | IMF |
| Euro area public debt | 90.2% of GDP | Eurogroup |
| France's debt (end of June 2026) | 119.0% of GDP, €3,595.5 billion | Insee |
| Italy's debt | 137.9% of GDP | IMF |
| Germany's growth, 2026 | 1.3% | Federal Government |
| France's rating | A+ (Fitch, S&P), Aa3 (Moody's) | Agencies, via iFRAP |
The facts
The euro area is expected to grow 1.1% in 2026 according to the IMF, held back by energy costs and weak consumer confidence (Trading Economics). Its public debt is set to reach 90.2% of GDP and its deficit 3.3%, pushed up in particular by higher defense spending (Lovguiden, citing the Eurogroup). The picture varies widely from one country to another.
- Germany is coming out of stagnation: the government expects 1.3% growth in 2026, thanks to exports and public investment made possible by loosening its debt brake, but employment is expected to fall 0.5% (Federal Government, retail-news.de).
- Italy has the heaviest debt of the large countries (137.9% of GDP according to the IMF), but a contained deficit of around 2.9% (Rick McElderry, citing the IMF).
- France has become the most worrying case.
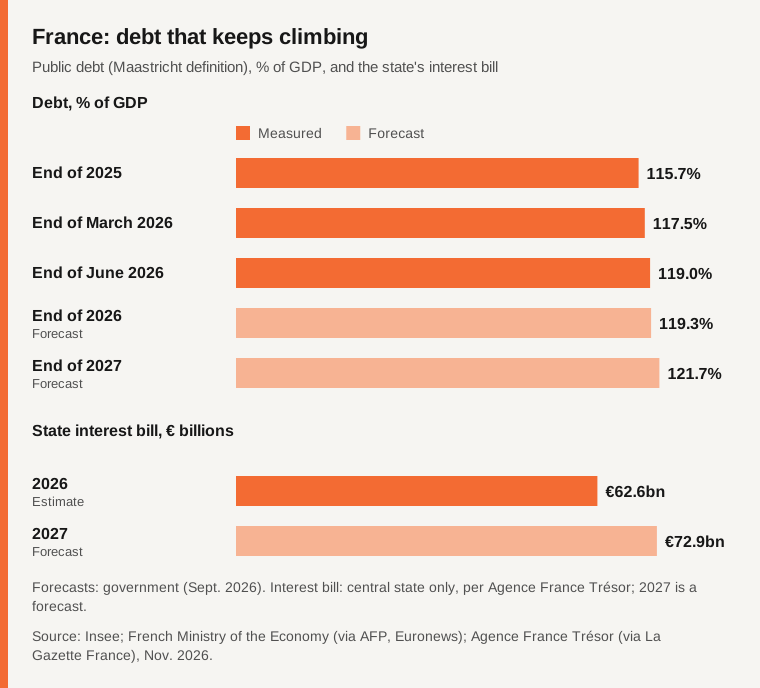
The French case. At the end of June 2026, public debt reached €3,595.5 billion, or 119.0% of GDP (Insee). The government projects 119.3% at the end of 2026 and 121.7% at the end of 2027, with a deficit of 5.4% then 5.0% of GDP (La Presse). That would be the highest level since the series began in 1978 (Euronews). For the central state alone, the interest bill would rise from €62.6 billion to €72.9 billion in 2027, according to Agence France Trésor (La Gazette France). For comparison, the national education budget is about €64.5 billion in 2026 (Major Prépa). The 2027 budget plans €54 billion of savings and adjustments (Euronews), a few months before the presidential election.
The causes
1. Productivity falling behind. The report Mario Draghi delivered to the European Commission in September 2024 found that Europe had fallen behind the United States in the technologies of the future and estimated that an extra €750–800 billion of investment a year would be needed to close the gap. Less productivity means less growth, and therefore a weaker "g" in our rate-versus-growth rule.
2. The energy shock. After the invasion of Ukraine in 2022, Europe lost most of its cheap Russian gas. Energy prices soared, then stayed higher than in the United States, which weighs on industry. The Iran war added a new shock in 2026.
3. Chinese competition. EU imports from China reached €558.8 billion in 2025, 54% above 2019, while exports to China fell (IMF, Finance & Development). The German car industry, long a champion in China, is the first to suffer.
4. Ageing and a costly social model. Europe is ageing faster than the United States. Pension and health spending is higher there, funded by fewer workers.
5. New defense spending. NATO's commitment to raise the effort to 5% of GDP by 2035 means, for many European countries, a considerable increase at a time when their budgets are already stretched.
6. The French case: fifty years of deficits and political instability. France has not presented a balanced central government budget since 1974. Since the dissolution of the National Assembly in 2024, no stable majority has emerged, which makes any multi-year plan difficult. The agencies drew the consequences: Fitch cut France to A+ in September 2025 and S&P in October 2025, while Moody's keeps it at Aa3 with a negative outlook (iFRAP).
What still holds
Europe remains one of the richest regions in the world, with abundant private savings, and France still borrows without difficulty, just at a higher price. Moody's also noted that France's 2025 deficit, at 5.1% of GDP, came in better than expected (La Gazette France). European institutions also showed, in 2012 and again in 2020, that they can act in a crisis.
Three scenarios for the decade
| Scenario | What happens | Consequence |
|---|---|---|
| Revival | Massive investment, a deeper single market, budgets gradually repaired | Growth picks up, debt stabilizes |
| Slow decline (closest to the current trend) | Growth around 1%, defense spending financed on credit | Interest costs crowd out schools and research |
| Confidence crisis | A large indebted country (France, Italy) sees its rates soar | The ECB must step in, with conditions |
7. The risk dashboard
To compare the four empires at a glance, here are two tools: a table of figures, then a grid that scores each weakness from 1 to 5.
| United States | China | Russia | Europe | |
|---|---|---|---|---|
| Public debt (2026) | 126.8% of GDP | 104.4% (135.3% "augmented") | ≈ 19% | 90.2% (euro area) |
| 2026 growth (IMF) | 2.3% | 4.5% | 0.9% | 1.1% (euro area) |
| Main illness | Deficits and interest | Property, prices, demography | War and oil dependence | Weak growth, ageing |
| What protects it | The dollar | Debt owed at home | Low debt | Wealth, savings, institutions |
| Most likely type of fall | A "rate shock" | Japan-style stagnation | Attrition | A confidence crisis in one country |
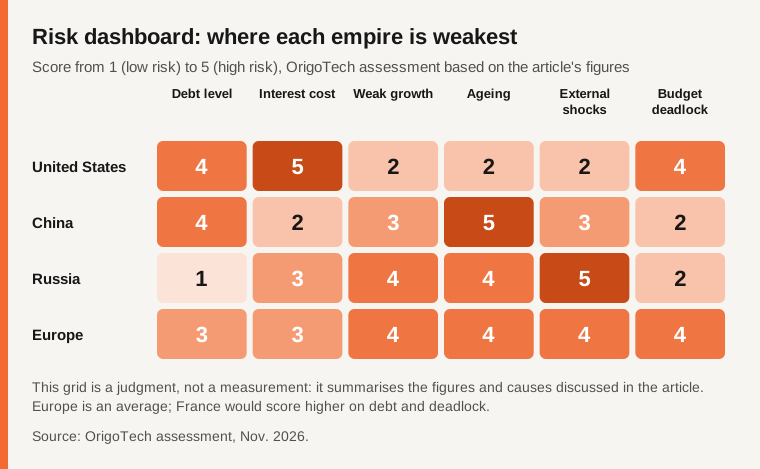
The common thread is expensive money. For ten years, low rates let everyone borrow painlessly. Since 2022, every government has been discovering the real price of its promises: pensions, health care, armies, subsidies. And in 2026, the Iran war added an oil shock: the IMF expects the average oil price to rise 41.3% in 2026 (Australian Industry Group, citing the IMF).
8. How a crisis could spread
These four economies are not islands. They trade with one another, borrow on the same markets and depend on the same raw materials. A crisis in one would pass to the others through several channels.
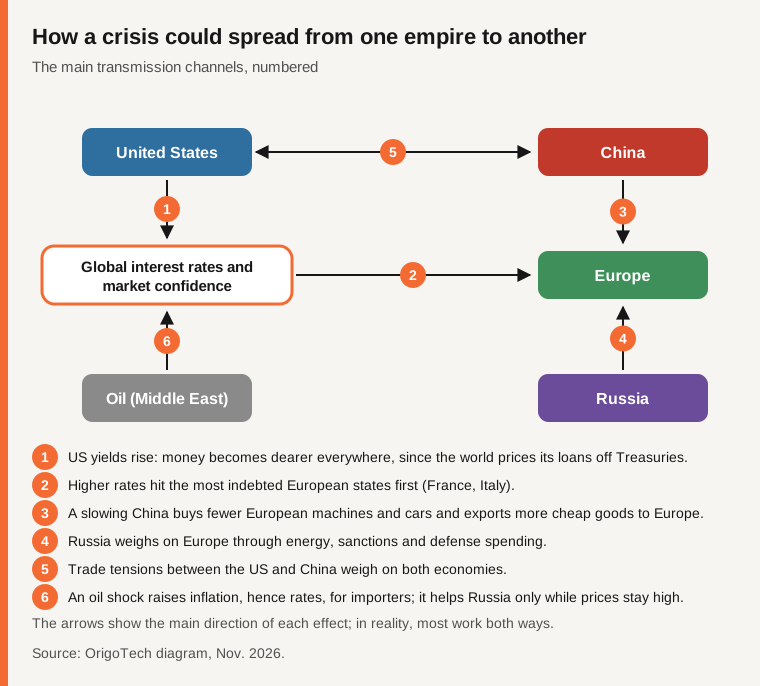
The most powerful channel is the first: US rates. The whole world prices its borrowing by looking at the price of US debt. When investors demand more to lend to Washington, they also demand more to lend to Paris, Rome or São Paulo. That is why US debt is not just an American problem.
The second point to remember concerns Europe: it sits at the crossroads of almost every channel. It is exposed to US rates, Chinese competition, the Russian threat and oil shocks. That is both its weakness and a reason to act quickly.
9. Solutions: what works and what doesn't
The four possible exits
History offers four ways out of a debt that has grown too heavy. None is painless.
| Exit | How it works | Advantage | Cost | Example |
|---|---|---|---|---|
| Growth | GDP grows faster than the debt | The least painful | Slow; cannot be decreed | Britain after 1945 |
| Fiscal effort | Spend less or tax more | Effective and credible | Unpopular; may slow the economy | Canada after 1995 |
| Inflation | Rising prices shrink the real value of the debt | Discreet | Impoverishes savers and workers, pushes rates up | The 1970s |
| Default or restructuring | Not everything is repaid | Immediate relief | Confidence ruined for a long time | Greece 2012 |
What history teaches us
The good news is that heavily indebted countries have managed to turn things around.
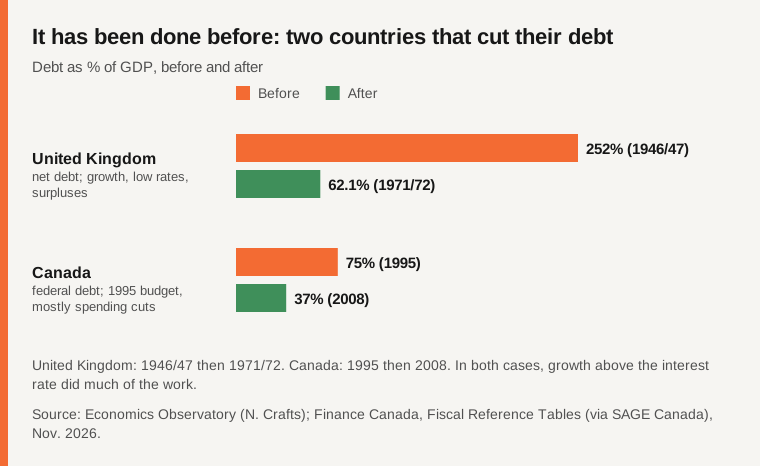
Britain after 1945. Its net debt peaked at 252% of GDP in 1946/47; 25 years later, in 1971/72, it was only 62.1% (Economics Observatory). How? According to economist Nicholas Crafts, about 60% of the fall came from growth above the real interest rate, and 40% from budget surpluses before interest (Economics Observatory). Rates were also held down by "financial repression" (capital controls, rules forcing banks to hold government debt) and, later, by inflation (OBR). These tools would be hard to reproduce today, with open markets and independent central banks. So it is not a model to copy: those forced low rates and that inflation are no longer possible today.
Canada after 1995. In the early 1990s, Canada was one of the most indebted G7 countries, and interest absorbed 38 cents of every dollar of federal revenue (Policy Options). The 1995 budget presented by Finance Minister Paul Martin launched a consolidation of about 5% of GDP over three years, mostly through spending cuts (Policy Options). The result: a surplus by 1997-98 and federal debt down from about 75% of GDP in 1995 to 37% in 2008 (SAGE Canada, citing Finance Canada). Strong growth, helped by the North American Free Trade Agreement, also played a part.
Both examples teach the same lesson: success combines a credible and sufficiently ambitious plan, growth above the interest rate and broad public agreement on the need to act. In Canada, the public debate had created a consensus that "something significant had to be done", even without agreement on the details (Policy Options).
Examples closer to today
One objection comes up often, and it is fair: post-war Britain looks nothing like the world of 2026. No government can force banks to lend to it cheaply anymore. The next three examples are more useful, because they happened in open economies, with independent central banks, ageing populations and modest growth.
Sweden in the 1990s. After a banking crisis, GDP fell three years in a row, the deficit reached 11% of GDP in 1993 and gross debt rose from 41% of GDP in 1990 to 73% in 1996 (VoxEU). The country adopted a multi-year plan of spending cuts and tax increases, then lasting rules: a surplus target over the whole business cycle and a spending ceiling set three years in advance. Result: a surplus of 3.6% of GDP in 2000 and debt brought down to 37% in 2011 (VoxEU). The limit: the krona had fallen sharply after Sweden dropped its fixed exchange rate, which revived exports. A eurozone country cannot devalue, and for that reason the economist Martin Flodén considers the Swedish experience hard to transpose to today's indebted countries (CEPR).
Germany between 2010 and 2019. Its debt rose to 82% of GDP in 2010, after the financial crisis, then fell back to 60% in 2019 (ifo). The "debt brake" written into the constitution in 2009 and the "black zero" policy produced budget surpluses. But Germany also benefited from exceptional conditions: record employment, rising tax revenue and interest rates close to zero. A Forum New Economy study attributes most of the decline to GDP growth rather than to repayment (Forum New Economy). The limit: those ultra-low rates are gone, and critics blame that decade for public underinvestment that the country is now trying to make up for by loosening the same brake.
Portugal between 2015 and 2025. This is probably the most telling example for today's Europe: a eurozone country, with no currency of its own, an ageing population and growth of about 2% a year. Fresh out of an international bailout, it had debt of about 132% of GDP in 2015 (Essential Business). By the end of 2025 it had fallen to 89.7%, its lowest level since 2009, with budget surpluses of 0.6% of GDP in 2024 and 0.7% in 2025 (ECO News). The recipe: surpluses before interest year after year, and nominal growth (inflation included) above the average rate paid on the debt, as the Bank of Portugal already noted in 2018 (Banco de Portugal). The limit: the road went through years of very harsh austerity, and Portugal's debt is still among the highest in the eurozone.
| Example | Debt at the start → at the end | What helped | What can't be repeated everywhere |
|---|---|---|---|
| Sweden, 1996 → 2011 | 73% → 37% of GDP | Multi-year plan, political consensus, strict fiscal rules | A sharp fall in the currency, impossible in the eurozone |
| Germany, 2010 → 2019 | 82% → 60% of GDP | Debt brake, surpluses, record employment | Near-zero interest rates; public investment sacrificed |
| Portugal, 2015 → 2025 | about 132% → 89.7% of GDP | Surpluses before interest, growth above the rate on the debt | Years of very harsh austerity at the start |
None of these countries needed post-war growth. All of them needed the same thing: a credible rule, kept for more than ten years, across changes of government. That is exactly what is hardest to achieve today in the United States and in France, where no stable majority is emerging. For Russia, none of these examples applies as long as the war goes on.
The levers, empire by empire
Choosing among these levers is a matter for democratic debate: we set out the most often cited options and their costs, not a program.
United States
| Lever | Expected effect | Cost or risk |
|---|---|---|
| A credible ten-year budget plan | Reassures markets, lowers the risk premium | Requires a compromise between the two parties |
| Social Security reform before 2032 | Avoids an automatic cut of about 22% in benefits | Raise contributions, the retirement age, or adjust benefits |
| More revenue (taxes) | Cuts the deficit quickly | Backed mostly by Democrats; opponents say it would slow activity |
| Less spending | Cuts the deficit durably | Backed mostly by Republicans; hits popular programs |
| An independent central bank | Markets believe inflation will not be used to erase the debt | Sometimes higher rates in the short run |
| Betting on AI productivity | Raises "g" | Uncertain, and not yet visible in the debt figures |
China
| Lever | Expected effect | Cost or risk |
|---|---|---|
| Strengthen pensions, health and unemployment insurance | Households save less and spend more | Costs public money in the short run |
| Reform the residence permit (hukou) | Gives migrant workers access to city public services | Local resistance, cost for cities |
| Finish cleaning up local debts | Defuses a time bomb | Losses to share between the state, banks and creditors |
| Let insolvent developers fail in an orderly way | The market finds a price floor | Short-term hit to confidence |
| End the property crisis | Revives household confidence | About 5% of GDP over three years, according to the IMF |
The IMF estimates that its recommendations as a whole could raise consumption by about 4 percentage points of GDP over five years (IMF), and that ending the property crisis would cost about 5% of GDP (Business Day).
Russia
| Lever | Expected effect | Cost or risk |
|---|---|---|
| Reduce the cost of the war | Frees the budget, allows lower rates | A political decision before an economic one |
| Raise taxes further | Fills the deficit | Holds back consumption and investment |
| Draw on reserves | Buys time | Reserves are already under half their pre-war level |
| Diversify beyond hydrocarbons | Reduces oil dependence | Very hard under sanctions and with 14% rates |
As long as the war absorbs such a large share of the budget, the central bank has to keep rates high and the civilian economy withers. The only variable that truly changes the equation is the cost of the war.
Europe (and France)
| Lever | Expected effect | Cost or risk |
|---|---|---|
| Invest massively (Draghi report) | Closes the productivity gap, raises "g" | €750–800 billion a year to finance |
| Unify capital markets | European savings finance European companies | National resistance, a long technical reform |
| Deepen the single market (energy, digital, defense) | Economies of scale, bigger companies | Sharing sovereignty |
| Common defense | Stops 27 countries buying separately and at higher cost | Hard political agreement |
| France: a gradual but steady deficit-reduction path | Stabilizes debt, regains the agencies' trust | Savings or taxes to choose, in a parliament without a majority |
| More people working, for longer | More revenue, less spending | A politically explosive subject (pensions) |
False good ideas
Some solutions often come up in the debate but do not stand up to scrutiny.
- "Just print money." Financing the state by creating money pushes up inflation, and therefore rates, and ruins confidence in the currency. Argentina is the repeated example.
- "Inflation will solve the problem on its own." It helped after 1945, but today lenders would immediately demand higher rates to protect themselves. Britain's Office for Budget Responsibility believes that persistently higher inflation would probably no longer be an effective way to reduce debt (OBR).
- "AI will fix everything." It can raise productivity, and therefore growth. But no one yet knows by how much or when. Building a budget on that bet would be like spending a salary you have not yet received.
- "Just tax the rich" or "just cut wasteful spending". Each of these can be part of a solution, but the sums involved are such that no country has ever repaired its finances with a single lever. Canada combined spending cuts and revenue increases, at a ratio of roughly seven to one (R Street).
Our reading: why "fall" may be the wrong word
The word "fall" conjures up Rome overrun in a single night. Economic reality looks more like Hemingway's line about going bankrupt: it happens "gradually, then suddenly". Gradually, because debts grow quietly for years. Suddenly, because confidence can tip in a few weeks, as in Britain in September 2022.
None of these four blocs is doomed. Each still has considerable strengths: the dollar for the United States, savings and industry for China, low debt for Russia, wealth and institutions for Europe. And history shows that far more indebted countries have pulled through.
But none can count on free money any longer to put off hard choices. The real danger is not the debt itself: it is letting interest payments decide, in place of leaders, what the state can still afford. When a country pays more for its past than for its future, it has begun to decline, even if no one has noticed yet. So the question is not whether these empires will fall, but whether they will act while they still have a choice of means.
FAQ
Can the United States go bankrupt?
Not in the way a company can: it borrows in dollars, a currency it issues. The realistic risk is different: durably higher rates, stronger inflation or a loss of confidence in the dollar, which would reduce Washington's room for maneuver and make credit more expensive worldwide.
Why is Russia fragile despite its low debt?
Because its weakness is not the amount of debt but the financing: it depends on oil, its reserves are melting, and it can only borrow on its domestic market, at high rates.
Could France face a Greek-style crisis?
The case is different: France is much larger, its debt is in high demand and it benefits from the European Central Bank's tools. But its interest bill is rising fast and eating into its margins; Fitch and S&P already cut it to A+ in 2025 (iFRAP).
What is China's "augmented" debt?
It is an IMF measure that adds the borrowing of financing companies created by local governments to official debt. It gives a fuller picture of what the Chinese state will, in practice, have to take on.
Why does Italy, more indebted than France, worry markets less today?
Because its deficit is smaller (around 2.9% of GDP against more than 5% in France): its debt grows more slowly. Markets watch the trajectory as much as the level.
What does all this change for me?
In practice, three things. Higher interest rates on mortgages and consumer loans, because they follow government rates. Pressure on public services and benefits, because every euro or dollar of interest is one that does not fund schools or hospitals. And, eventually, debates on taxes and the retirement age.
Do you need post-war growth to reduce debt?
No. Portugal brought its debt down from about 132% to 89.7% of GDP between 2015 and 2025 with growth of about 2% a year (ECO News). What matters is that growth, inflation included, stays above the rate paid on the debt, and that the state runs a surplus before interest for several years.
Is a global crisis imminent?
Nothing suggests so in the short term: states continue to borrow without difficulty. The risk is rather a slow erosion, punctuated by occasional shocks (like the rise in US rates in September 2026). It is precisely during this calm period that acting costs the least.
Method and limits
Figures consulted between Nov. 7 and 9, 2026. Data for 2026 and beyond are mostly forecasts (IMF, governments, central banks) that will be revised. Definitions of debt differ between sources: we state which one is used. Several figures come from media outlets citing official data; we attribute them each time. The scenarios, the risk grid and the rate-versus-growth simulation are teaching tools built by OrigoTech, not forecasts. "Our reading" is an interpretation, not a fact. This article is not investment advice.
Sources
- Bernama (Xinhua): US National Debt Tops US$40 Trillion For First Time (verified 2026-11-08)
- American Action Forum: U.S. Treasury: FY 2026 Deficit Totaled $2 Trillion (verified 2026-11-08)
- WFTV (AP): US national debt passes $40 trillion milestone (verified 2026-11-08)
- Crypto Briefing (KuCoin): US National Debt Surpasses $40 Trillion for the First Time (verified 2026-11-08)
- Trading Economics: US 10Y Bond Yield Hits 19-year High (verified 2026-11-08)
- investingLive: The full statement from the October 2026 FOMC rate decision (verified 2026-11-08)
- Reason: The 'Big Beautiful Bill' Will Add $2.4 Trillion to the Deficit (verified 2026-11-09)
- Washington Examiner: CBO says 'big, beautiful bill' will add $3.4 trillion to deficits in final estimate (verified 2026-11-09)
- Congressional Research Service: Social Security, Selected Findings of the 2026 Annual Report (verified 2026-11-09)
- NARSSA: Inside the 2026 Social Security Trustees Report (verified 2026-11-09)
- Washington Examiner: Moody's downgrades US credit ratings (verified 2026-11-09)
- PBS (AP): Moody's strips U.S. government of top credit rating (verified 2026-11-09)
- Hoover Institution: Ferguson's Law, Debt Service, Military Spending, and the Fiscal Limits of Power (verified 2026-11-08)
- The Pynx: Ferguson's Folly (verified 2026-11-08)
- IMF: Fiscal Monitor, gross debt (October 2026) (verified 2026-11-08)
- IMF: 2025 Article IV Consultation with China (verified 2026-11-08)
- IMF: How China's Economy Can Pivot to Consumption-led Growth (verified 2026-11-09)
- IMF, Finance & Development: China's Emerging Economic Engine (verified 2026-11-09)
- Pattaya Mail: IMF warns in Bangkok global public debt could hit 100% of GDP by 2029 (verified 2026-11-08)
- IMF: October 2025 Fiscal Monitor (verified 2026-11-08)
- Trading Economics: IMF Upgrades 2026 Global Growth Forecast (verified 2026-11-08)
- Australian Industry Group: Global forecasts, October 2026 (verified 2026-11-08)
- OSW: NATO summit in The Hague, a two-component 5% of GDP on defence (verified 2026-11-09)
- Yeni Şafak: China economy grows 4.5% in third quarter 2026 (verified 2026-11-08)
- Rhodium Group: China's Economy, Rightsizing 2025, Looking Ahead to 2026 (verified 2026-11-09)
- BBVA Research: China Economic Outlook, September 2026 (verified 2026-11-08)
- Caixin: China's Population Decline Accelerates as Births Hit Modern-Era Low in 2025 (verified 2026-11-08)
- Caixin: China Unveils More Nuanced Economic Plan for 2026 (verified 2026-11-08)
- Caixin: The Consumption Conundrum Dividing China's Economists (verified 2026-11-09)
- Business Standard: Why China's economy would be more vulnerable to Trump tariffs this time (verified 2026-11-08)
- Business Day: IMF urges China to make 'brave choices' (verified 2026-11-08)
- Gulf Times: China's property crisis, why the market is a mess (verified 2026-11-09)
- CFR: Does Evergrande's Collapse Threaten China's Economy? (verified 2026-11-09)
- The Moscow Times: IMF Slashes Russia's 2026 Growth Forecast to 0.8% (verified 2026-11-08)
- Interfax: IMF lowers Russia growth forecast for 2026-2027 (verified 2026-11-08)
- Interfax: Central Bank of Russia again keeps key rate at 14% (verified 2026-11-08)
- Interfax: "Tes" news feed (July 2026) (verified 2026-11-08)
- United24: Russia's National Wealth Fund Could Run Dry Within a Year, Gazprombank Analysts Warn (verified 2026-11-08)
- The Moscow Times: Russia to Tap National Wealth Fund at Record Pace (verified 2026-11-08)
- The Moscow Times: Did the Mideast Conflict Just Rescue Russia's War Budget? (verified 2026-11-08)
- The Moscow Times: More Taxes for More War, Unpacking Russia's 2026 Budget (verified 2026-11-09)
- The Moscow Times: More Taxes for More War (VAT at 22%) (verified 2026-11-09)
- Carnegie Endowment: Russian economy forecast (verified 2026-11-09)
- BOFIT (Bank of Finland): Russian budget framework for 2026-2028 (verified 2026-11-09)
- NV (Bloomberg): Russian oil revenues continue to slump (verified 2026-11-08)
- Jamestown Foundation: Central Bank and Finance Ministry Warn Putin of War's Impact on Economy (verified 2026-11-08)
- TASS: Russia's public debt lowest among G20 nations in 2026, IMF (verified 2026-11-08)
- Y94 (Reuters): Russia's debt-servicing costs to rise 22.5% in 2026 (verified 2026-11-08)
- The Star: Russian central bank holds key rate steady at 14 pct (verified 2026-11-08)
- Lovguiden: Eurogroup, neutral fiscal stance in 2026 (verified 2026-11-08)
- German Federal Government: The German economy is growing again (verified 2026-11-08)
- retail-news.de: Bundesregierung hebt Wachstumsprognose für 2026 an (verified 2026-11-08)
- Rick McElderry: Global Economy Report, October 2026 (verified 2026-11-08)
- Insee: quarterly Maastricht debt, second quarter 2026 (verified 2026-11-08)
- La Presse: France, public debt could reach 121.7% of GDP in 2027 (verified 2026-11-08)
- Euronews: French public debt soars to 119% of GDP (verified 2026-11-08)
- Euronews: France's debt at its highest since 1978 (verified 2026-11-08)
- La Gazette France: debt reached 119% of GDP (verified 2026-11-08)
- La Gazette France: Moody's keeps France's sovereign rating (verified 2026-11-09)
- iFRAP: Note on France's debt, lessons from Greece and Portugal (verified 2026-11-09)
- Major Prépa: public debt, second quarter 2026 (verified 2026-11-08)
- Economics Observatory: Rebuilding after the Second World War, what lessons for today? (verified 2026-11-09)
- Economics Observatory: Questions and answers (N. Crafts) (verified 2026-11-09)
- Office for Budget Responsibility: Long-run drivers of UK government debt (verified 2026-11-09)
- Policy Options: The virtuous cycle, the Canadian experience in a G7 context (verified 2026-11-09)
- Policy Options: size of the Canadian consolidation (verified 2026-11-09)
- Policy Options: the Canadian virtuous cycle (French-language site) (verified 2026-11-09)
- SAGE Canada: Charting Canada's Fiscal Trajectory, 1990-91 to 2024-25 (verified 2026-11-09)
- R Street: Lessons from Canadian Debt Reduction (verified 2026-11-09)
- VoxEU (Lars Calmfors): What can Europe learn from Sweden? Four lessons for fiscal discipline (verified 2026-11-09)
- CEPR (Martin Flodén): A Role Model for the Conduct of Fiscal Policy? Experiences from Sweden (verified 2026-11-09)
- ifo (Clemens Fuest): The Merkel Era, a review of budgetary and fiscal policy (verified 2026-11-09)
- Forum New Economy: German public debt after a decade of fiscal consolidation (verified 2026-11-09)
- Essential Business: Portugal's results "extraordinary", says Finance Minister (verified 2026-11-09)
- ECO News: Government posts impressive public accounts, surplus reaches 0.7% (verified 2026-11-09)
- Banco de Portugal: Economic Bulletin, May 2018 (verified 2026-11-09)
Spotted an error in this article? Report it · Our corrections policy